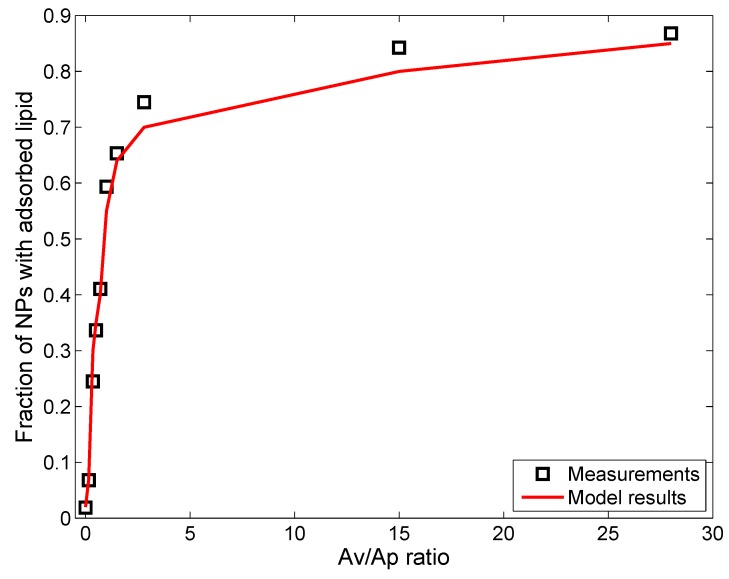
Figure 4.
Comparison of model predictions (red line) of fraction of NPs (N600; initial mean diameter = 600 nm; other ENM properties in Table 5) with adsorbed lipids after 1 h of incubation, with in vitro measurements (black squares) from Nordlund et al. [39] for different values of surface area ratios of lipid vesicle to particle.

