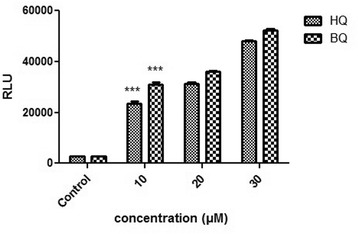
Fig. 4.

ARE inductions in stable transfected Huh7 exposed to HQ and BQ (10, 20, and 30 μM). Luciferase activity was measured after 24 h. The numbers in the left column represent the relative luciferase activities. Luciferase activity was increased following treatment with increasing concentrations of oxidative stress inducers. Each bar shows the mean ± SD; ***, p <0.001 compared to control
