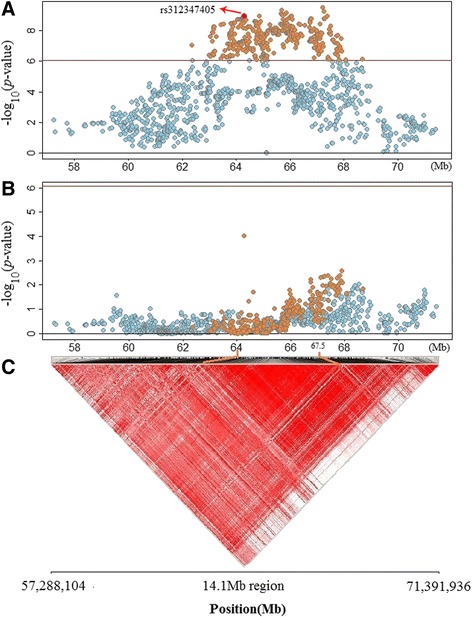
Fig. 3.

Regional plot and conditional analysis in multivariate model for ESW. Plot a: Up to 1531 significant SNPs (orange and blue points) obtained by univariate model were re-analyzed for their association with ESW by multivariate model (multiple time points). The -log10 (observed P-values) of SNPs (y-axis) are presented according to their chromosomal positions (x-axis). Totally 503 SNPs (orange points) reached genome-wide significance level (black line, 8.43 × 10⁻⁷). Plot b: The genotype of rs312347405 was put into the multivariate model as covariances for conditional analysis. After conditioning on rs312347405, the significant SNPs in plot A (orange points) were all substantially attenuated below genome-wide significant level in plot B. Plot c: regional plot shows extremely strong linkage disequilibrium status exist in this 14.1 Mb region, especially for the LD block from 64.0 to 67.5 Mb
