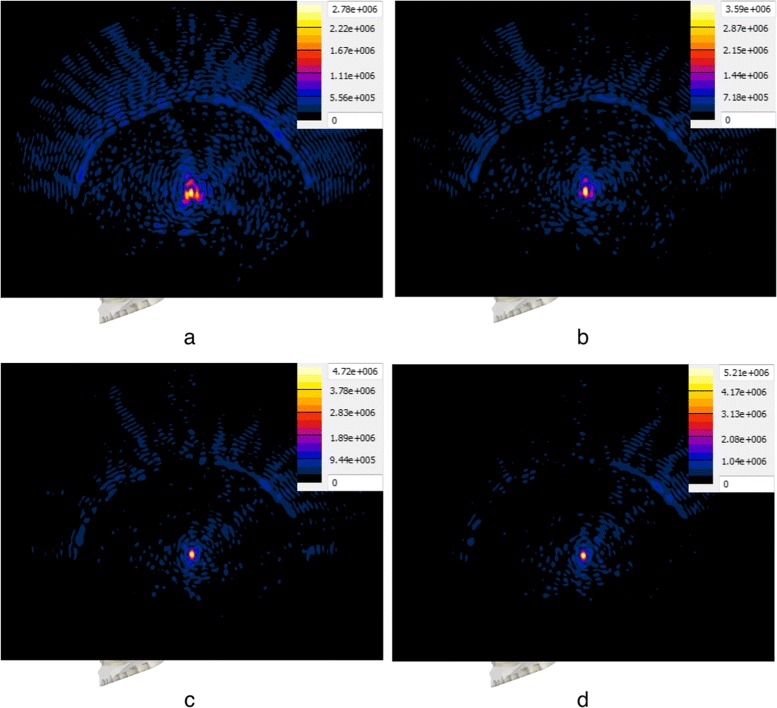
Fig. 5.

Pressure distribution comparison for different focusing approaches. Absolute pressure distribution in megapascal resulting from the use of the four approaches with the “Thalamic VIM (right)” target. Each distribution is plotted on the sagittal plane through the target, accompanied by the respective color map and scaled to the respective maximum absolute pressure. The distribution resulting from the DPC approach a shows a heavily distorted focal region and relatively low pressure amplitude at the target. Delineation of the focal region and amplitude improve slightly with the RTPC approach (b), while a significant improvement is seen in the case of the SPC (c) and SPAC (d) approaches
