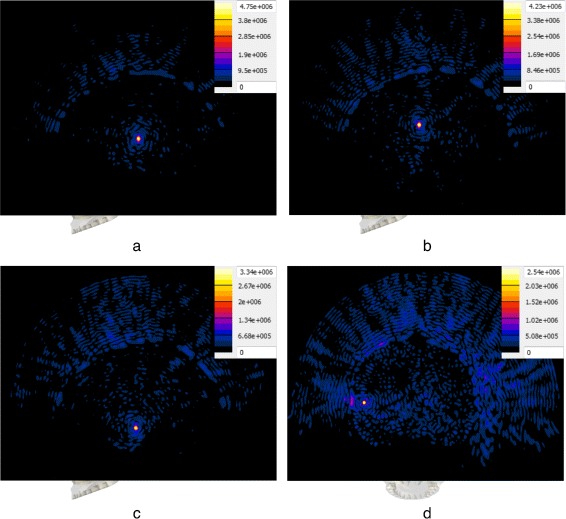
Fig. 6.

Pressure distribution comparison for four types of targets. Absolute pressure distribution in megapascal resulting from the use of the SPC approach with four selected targets. Each distribution is plotted on a plane through the target, accompanied by the respective color map and scaled to the respective maximum absolute pressure. Distributions a–c are plotted on the sagittal plane, while distribution d is plotted on the coronal plane. The two structure targets above the transducer’s focal plane, “Thalamic VIM (left)” (a) and “Corpus Callosum (medial)” (b), show sharply delineated focal regions with very high pressure amplitudes. The resulting distribution for “Amygdala (left)” (c), a structure target below the focal plane, shows successful refocusing but significantly lower pressure amplitude. In the case of the cortex target “Auditory Cortex (left)” (d), a focus is visible at the target location but significant energy deposition in the patient’s scalp and skull is observed
