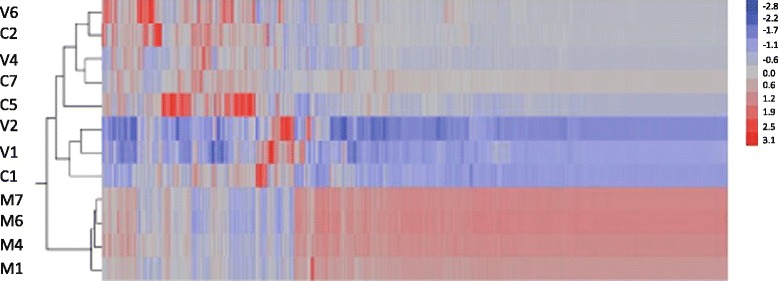
Fig. 1.

Patterns of gene expression in individual queens. The Heatmap was obtained after hierarchical clustering analysis of log2-transformed and normalized read counts that corresponded to 1088 genes significantly differentially expressed across treatments. The analysis shows that mated queens cluster separately as compared to virgin and CO2-treated queens. Genes in red are significantly up-regulated while genes in blue are significantly down-regulated. V = virgin, M = mated, C = CO2-treated
