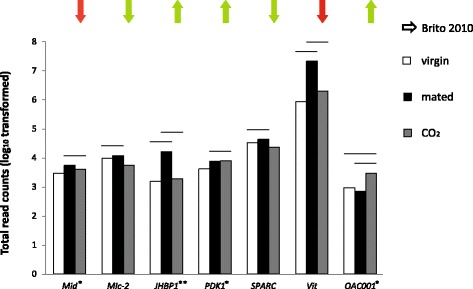
Fig. 5.

Response to carbon dioxide. Patterns of expression of 7 genes that were included in Brito et al. [64] and were also significantly differentially expressed in our study. Lines above bars indicate the pairwise comparisons where the genes were significantly differentially expressed (P-value < 0.05). Arrows show direction of expression for Brito et al. [64] (brains of CO2-treated vs. untreated 8-day-old queens): green = same trend as in our study; red = opposite trend. See Additional file 7 for more information on this comparative study
