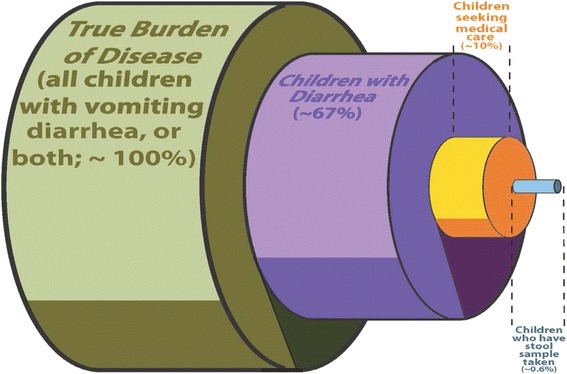
Fig. 2.

Overall societal burden of disease in relation to those who undergo testing. The image portrays the total burden of acute gastroenteritis (green), in relation to the smaller subset that have diarrhea (only group eligible for testing; purple). This is followed by the much smaller proportion who actually seek medical care (yellow) and lastly by the tiny proportion who actually undergo testing (note, even when tested, standard testing is limited by the ability to identify the organisms causing 20 – 30 % of disease)
