
Fig. 2.
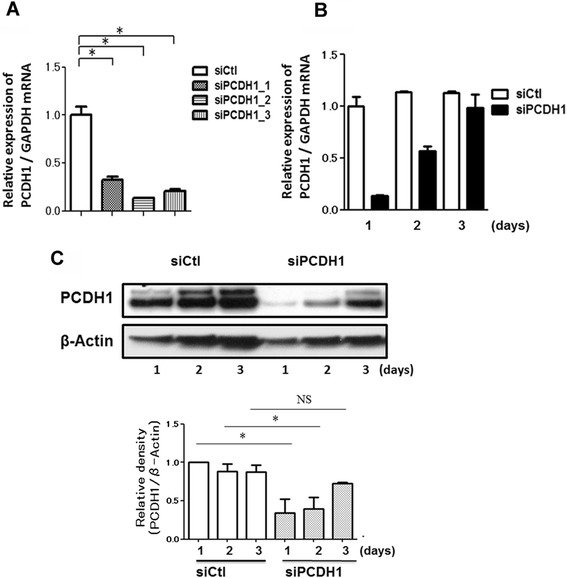
Gene knockdown efficacy of protocadherin-1 (PCDH1)-specific siRNAs. Quantification of PCDH1 mRNA by real-time polymerase chain reaction. a mRNA was purified from the cells harvested at 24 h after transfection of the control (siCtl) or PCDH1-specific siRNAs (siPCDH1_1, siPCDH1_2, and siPCDH1_3). Results are expressed relative to the control value (siCtl-treated cells) and are mean ± SD values; n = 3 independent samples. Asterisks indicate a statistically significant difference (p ≤ 0.05) in the result between that of cells treated with siCtl. b Time course of PCDH1 mRNA expression after PCDH1 siRNA transfection. mRNA was purified from cells harvested at indicated time points after the transfection of siCtl or siPCDH1_1. Results are expressed relative to the control value (siCtl-treated cells at day 1) and are mean ± SD values; n = 3 independent samples. c Time course of PCDH1 protein expression after PCDH1 siRNA transfection. Cell lysates were harvested at the indicated time points after siCtl or siPCDH1_1 transfection and western blotted with anti-PCDH1 antibody. The data represent the mean from three independent experiments (upper photograph). The lower graph shows densitometric quantification of PCDH1 bands on western blots, relative to β-actin. Results are expressed as a relative density compared to the control value (siCtl-treated cells) and are mean ± SD values; n = 3 independent samples. Asterisk indicates a statistically significant difference (p ≤ 0.05) in the result between that of cells treated with siCtl. NS: not significant