
Fig. 1.
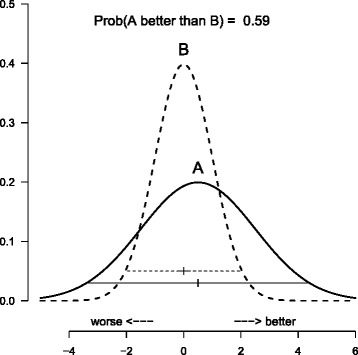
Fictitious example. Two normal posterior distributions following N(0,1) (dashed) and N(0.5, 22) (continuous) with credible intervals. The probability that treatment A, corresponding to the flat distribution, is better than treatment B, corresponding to the steep distribution, is 59 %