
Fig. 2.
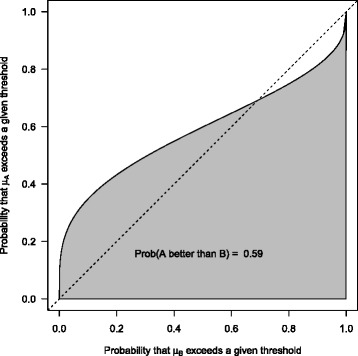
Fictitious example: ROC curve. ROC curve and area under the curve (AUC) corresponding to the example of Fig. 1 (AUC = 0.59)
Official websites use .gov
A
.gov website belongs to an official
government organization in the United States.
Secure .gov websites use HTTPS
A lock (
) or https:// means you've safely
connected to the .gov website. Share sensitive
information only on official, secure websites.
Fictitious example: ROC curve. ROC curve and area under the curve (AUC) corresponding to the example of Fig. 1 (AUC = 0.59)