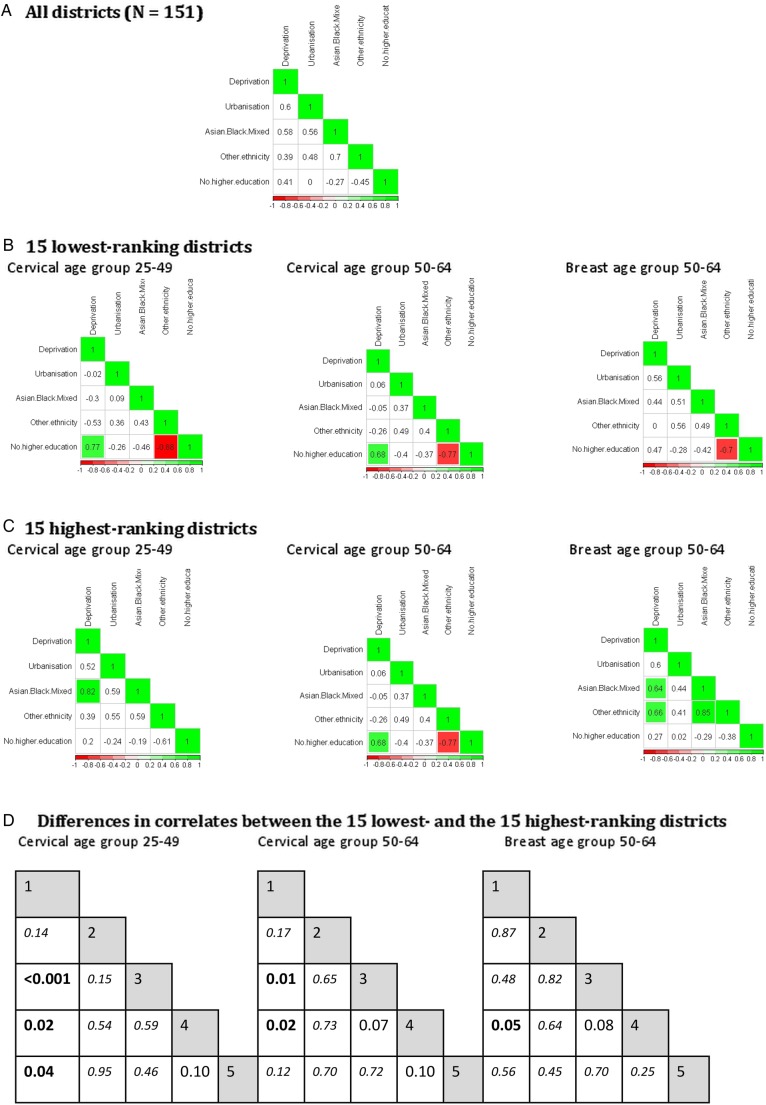
Figure 3.
Correlations between population factors, overall, and among the 15 highest and 15 lowest ranking districts after risk adjustment. Correlation coefficients are displayed in each cell: (A) all districts; (B) 15 lowest ranking districts and (C) 15 highest ranking districts. For the 15 lowest and 15 highest ranking districts, correlation coefficients which are significantly different from zero at the 1% level are highlighted in green for positive correlations, and in red for negative correlations. (D). Fisher's z test for significant differences in correlation coefficients between two independent groups. Bold represents p values < 0.05. Italic represents p values not significant at the 10% level. 1, % deprivation; 2, % urbanisation; 3, % Asian, black or mixed ethnic minority groups; 4, % ‘other’ ethnic minority groups; 5, % no higher education.

