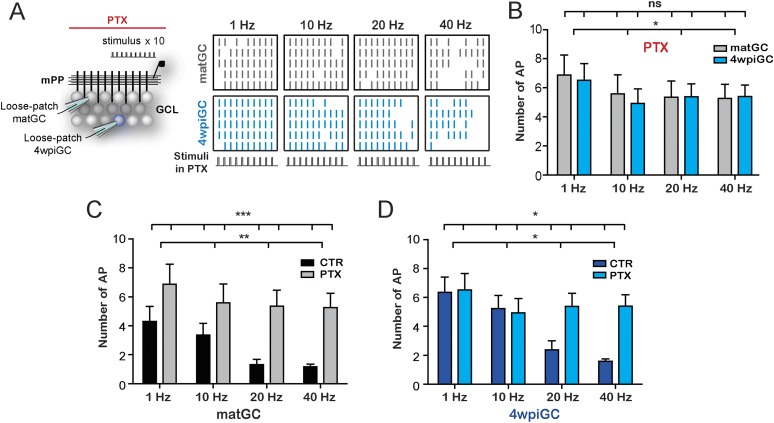
Figure 2. GABAergic inhibition generates the difference between mature and immature GC.
(A) Left, the scheme shows the recording configuration, a stimulating electrode was placed in the medial perforant path (mPP) to deliver 10 stimuli at different frequencies; the stimulation intensity was kept at 50% fEPSP. Loose patch recordings were obtained from mature GC (matGC) and 4wpiGC to detect spikes in the presence of picrotoxin (PTX). Right, Raster plots from one matGC (in black) and one 4wpiGC (in blue) at 1 Hz, 10 Hz, 20 Hz, and 40 Hz. Each color line denotes a spike. Responses of neurons were recorded in PTX. (B) Average of the sum of action potentials evoked by stimulation trains of 1 Hz, 10 Hz, 20 Hz, and 40 Hz, in matGC (gray columns) and 4wpiGC (light blue columns) in the presence of PTX. Activation slightly decreases with frequency in both cells, but there were not significant differences among matGC and 4wpiGC (two-way ANOVA, variation between GC: ns; variation in frequency: *p < 0.05; interaction: ns, p > 0.05 N = 23 cells for both GC at the four frequencies). (C) Comparison of matGC activation to stimulation with trains in control conditions and when inhibition was blocked with PTX. Activation of matGC was higher in the presence of PTX at all frequencies (two-way ANOVA, variation between treatments: ***p < 0.001; frequency variation. **p < 0.01; interaction: ns, p > 0.05). (D) Comparison of 4wpiGC activation to stimulation with trains in control conditions and when inhibition was blocked with PTX. The effect of blocking inhibition in 4wpiGC varies with frequency. Activation increases only at high stimulation frequencies (two-way ANOVA variation between treatments: *p < 0.05; variation between frequencies: *p < 0.05; positive interaction p < 0.01; at 40 Hz, p < 0.01, Bonferroni post-test). Error bars indicate SEM.

