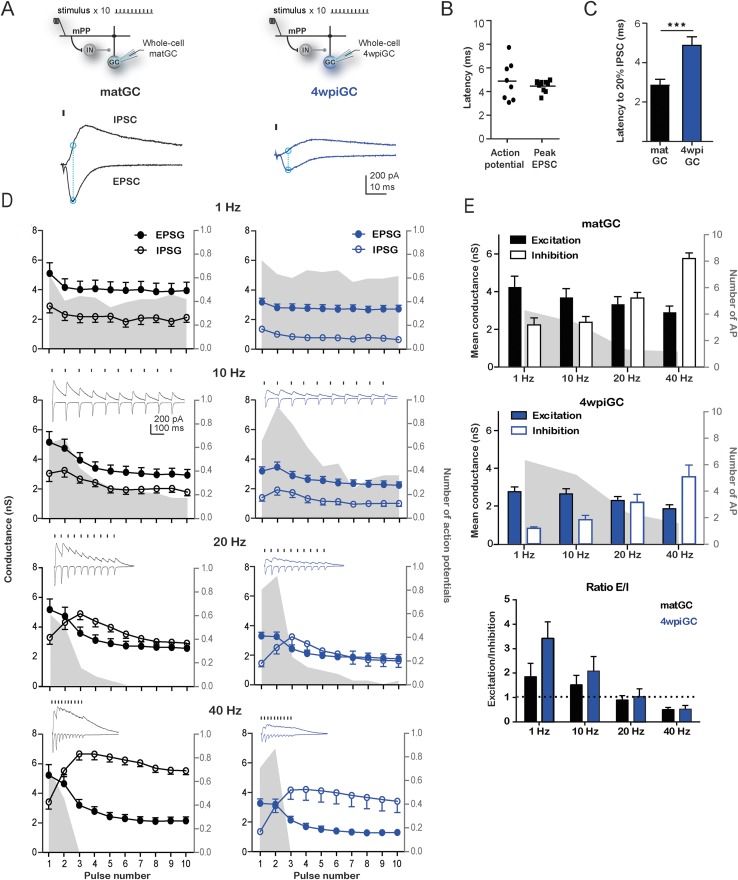
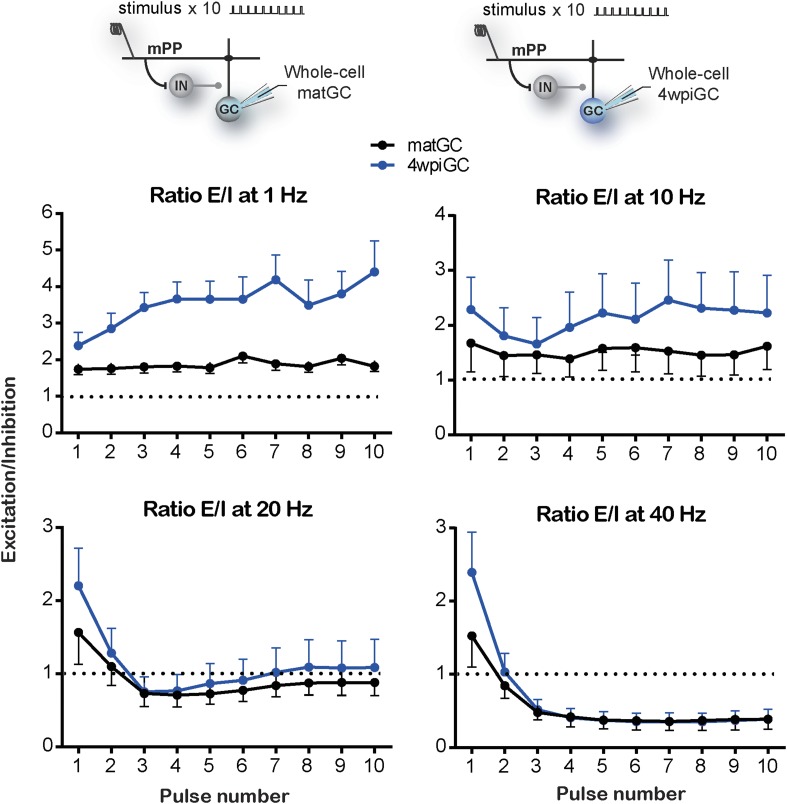
Figure 3. Interaction between excitation and inhibition determines the response of GC to frequency.
(A) Top, the schemes show the recording configuration. Whole-cell voltage-clamp recordings were obtained from matGC and 4wiGC in response to stimulation of mPP with trains at different frequencies. Bottom, example of recordings. IPSCs were recorded at the reversal potential of excitation (−60 mV), and EPSCs were recorded at the reversal potential of inhibition (0 mV). The dash indicates the time of the stimulus. In subsequent quantifications, excitation and inhibition were measured at the peak of the EPSC, marked with blue in the trace. Traces in black correspond to matGC and in blue to 4wpiGC. (B) Latency to action potentials compared to latency of the peak EPSC measured from the stimulating artifact. The action potentials and the peak of the EPSC occur close in time. (C) Average latency to reach the 20% of the peak IPSC evoked by the first stimulation pulse at 1 Hz in matGC (black) and 4wpiGC (blue). The IPSC is slower in 4wpiGC than in matGC (***p < 0.001, t test). (D) Average excitatory (EPSG) and inhibitory (IPSG) conductance evoked by each pulse in the train at 1 Hz, 10 Hz, 20 Hz, and 40 Hz. The values were calculated as indicated in A. For comparison, the spiking probability for each pulse in the train obtained from Figure 1A is plotted as the gray shadow in the back. The insets show representative current traces obtained for each frequency. Dashes indicate stimuli. (E) Average of the mean of excitatory and inhibitory conductances evoked by the 10 pulses in matGC and 4wpiGC. Excitation decreases with frequency and is higher in matGC than in 4wpiGC at all frequencies of stimulation (two-way ANOVA paired between frequencies; variation between GC: * p < 0.05; variation between frequencies. ***p < 0.001; interaction: ns, p > 0.05; N (4wpiGC) = 17 cells N (matGC) = 14 cells at the four frequencies). Inhibition increases with frequency and is higher in matGC than in 4wpiGC that at all frequencies of stimulation (two-way ANOVA paired between frequencies; variation between GC: ***p < 0.001; frequency variation. ***p < 0.001; interaction: ns, p > 0.05. N (4wpiGC) = 9 cells and N (matGC) = 11 cells at the four frequencies). For comparison, the average number of action potentials is plotted as a gray shadow in the back. Bottom: ratios between mean EPSG and IPSG evoked along train stimulation at 1, 10, 20, and 40 Hz for 4wpiGC (blue) and matGC (black). Dotted lines show the switch between higher excitation (above ratio = 1) and inhibition (below ratio = 1) balance. Error bars indicate SEM. Stimulation artifacts were erased from traces for better visualization.


