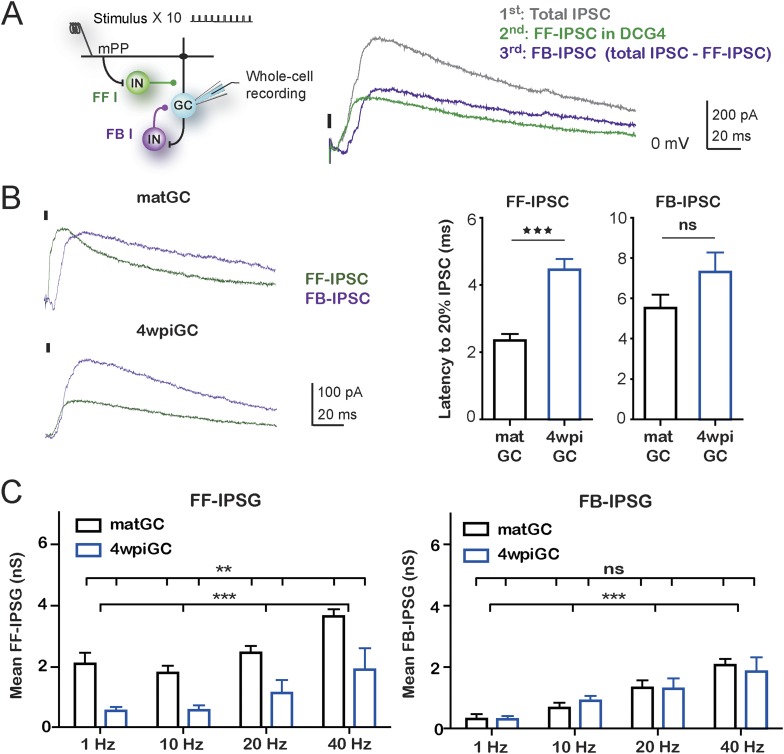
Figure 4. Feedforward inhibition generates differences between mature and immature GC.
(A) Recording configuration showing the activated circuit. Stimulation of mPP-activated monosynaptic excitation and feedforward inhibition (FF I, green). Feedback inhibition (FB I, purple) is recruited by the activity of GC. Right traces show inhibitory currents recorded in whole cell, voltage clamping the cell at the reversal potential of excitation (∼0 mV). The recorded total inhibitory post-synaptic current (total IPSC) obtained under control conditions is in gray. Application of DCG4 abolished feedback IPSC leaving only the feedforward IPSC (FF-IPSC, green trace). Feedback IPSC (FB-IPSC, purple trace) was measured by subtraction of the FF-IPSC from the total IPSC. (B) Left, traces from representative recordings of FF-IPSC and FB-IPSC from matGC and 4wpiGC. FF-IPSC in 4wpiGC is slower. The dash indicates the time of the stimulus. Right, average latency to reach 20% of the peak IPSC evoked by the first stimulation pulse at 1 Hz for FF and FB inhibition in matGC and 4wpiGC. The IPSC-FF is slower in 4wpiGC than in matGC (***p < 0.001, t test). The latency of the IPSC-FB did not show significant differences between 4wpiGC and matGC (ns, p > 0.05, t test). (C) Left, mean FF inhibitory postsynaptic conductance (IPSG-FF) evoked by stimulation of 10 pulses to mPP measured at the peak of the EPSC in matGC and 4wpiGC. The IPSG-FF increases with frequency and is higher in matGC than in 4wpiGC at all frequencies of stimulation (two-way ANOVA paired between frequencies; variation between GC: **p < 0.01; frequency variation. ***p < 0.001; interaction: ns, p > 0.05). Right, mean FB inhibitory postsynaptic conductance (IPSG-FB) evoked by stimulation of 10 pulses to mPP measured at the peak of the EPSC in matGC and 4wpiGC. The IPSG-FB shows no differences between matGC and 4wpiGC, but increases in both GC with frequency (two-way ANOVA paired between frequencies; variation between GC: ns, p > 0.05; variation between frequencies. ***p < 0.001; interaction: ns, p > 0.05). N (4wpiGC) = 6–7 cells, N (matGC) = 10–11 cells, in the four frequencies. Error bars indicate SEM. Stimulation artifacts were erased from traces for better visualization.


