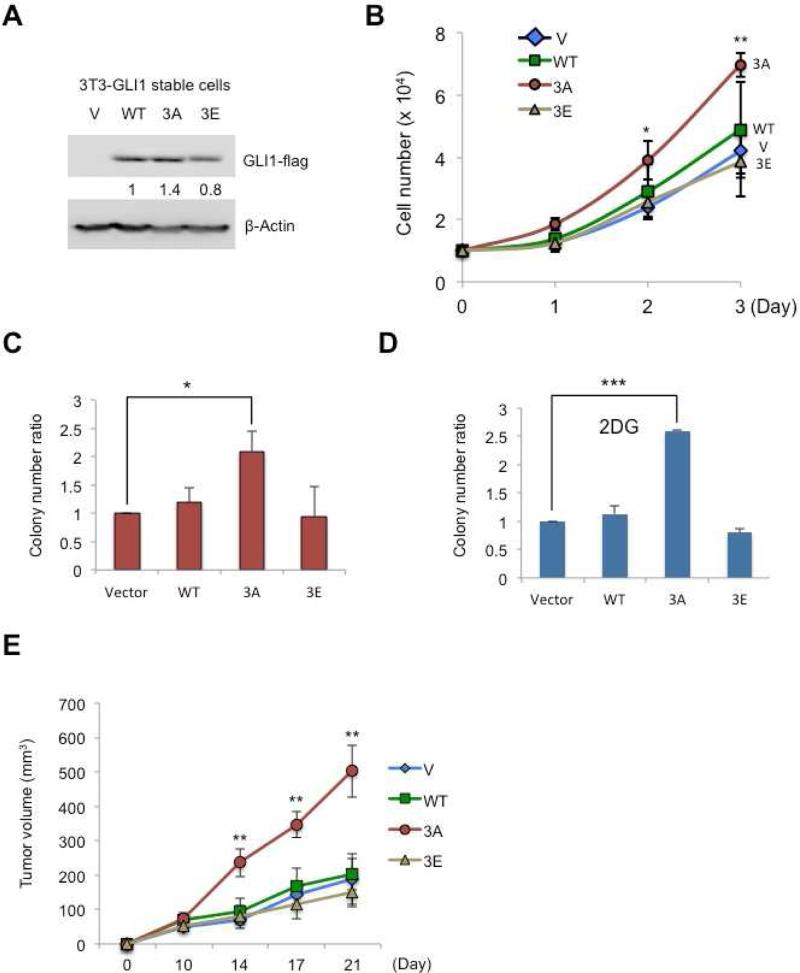
Figure 5.
Tests of cell division, colony formation and oncogenic effects of mutant GLI1 proteins. (A) NIH3T3 cells were infected with vector, GLI1WT, GLI13A, or GLI13E lentivirus, with Flag tags on each protein, and selected for 7 days with puromycin (2.5ugml-1). Cell lysates were analyzed by immunoblotting with Flag antibody to measure the amounts of the expressed proteins. (B) This experiment used NIH3T3 GLI1-stable cell lines (vector control, WT, 3A, and 3E). 5 × 10³ cells were seeded into 12-well plates for growth assays, each cell type in triplicate, and cells were counted using a hemocytometer for three consecutive days. The experiment was repeated three times (“ * ” p<0.01, “ ** ” p<0.001). (C) NIH3T3 cells with GLI1WT, GLI13A, or GLI13Estably expressed were seeded into 6-well plates for colony formation assays for 2 weeks. Colonies larger than 1.5 mm were counted. (D) As in (C) the cells were treated with 2DG (25mM) and 2DG-containing medium. The medium in 2DG-treated wells was changed every three days to refresh the 2DG. Colony numbers were counted two weeks later. In (C) and (D), each cell line was seeded in duplicate, with N=3 (“ * ” p<0.05, “ *** ” p<0.0001). (E) NIH3T3 GLI1-stable cell lines (Vector control, WT, 3A, and 3E). 107 cells were injected subcutaneously into the nude mice and tumor growth was monitored for three weeks (“ ** ” p<0.001).

