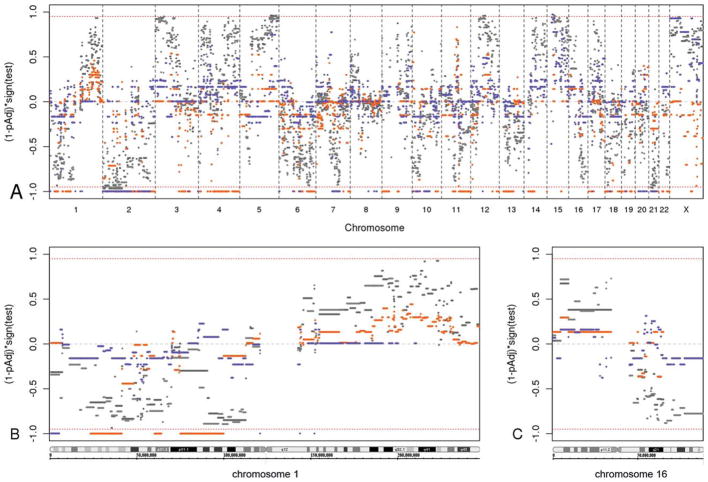
Figure 3.
Statistical test results are illustrated for differential genomic copy number aberrations in estrogen receptor (ER)-negative relative to ER-positive breast carcinomas. The red bars present the genomic identification of significant targets in cancer (GISTIC) analysis of gained segments, and blue bars indicate the GISTIC analysis of deleted segments. Light and dark shades of gray present the z-statistic results of gained and deleted segments, respectively. The red dashed line marks multiple-comparison, adjusted P values (1 – pAdj) of .05. (A) This is an overview of the adjusted P values for all genomic segments from the GISTIC and z-statistic analyses. The x-axis depicts the genomic coordinates arranged in chromosome number order with the short arm (p) to the left and the long arm (q) to the right within each chromosome. The y-axis represents the results from testing the difference of log2 ratios between ER-positive cancers and ER-negative cancers, with the values representing (1 – pAdj) times the test result’s sign; the sign represents the direction of the 2-tailed statistical test result, in which a positive sign (upper half) indicates relative gain in ER-positive samples compared with ER-negative samples (ie, a relative loss in ER-negative samples), and a negative sign (lower half) indicates relative loss in ER-positive samples (ie, relative gain in ER-negative samples). Values near ±1 are statistically highly significant, whereas values near 0 are not. (B) This is a detailed view of the adjusted P values of chromosome 1 genomic segments. (C) This is a detailed view of the adjusted P values of chromosome 16 genomic segments.

