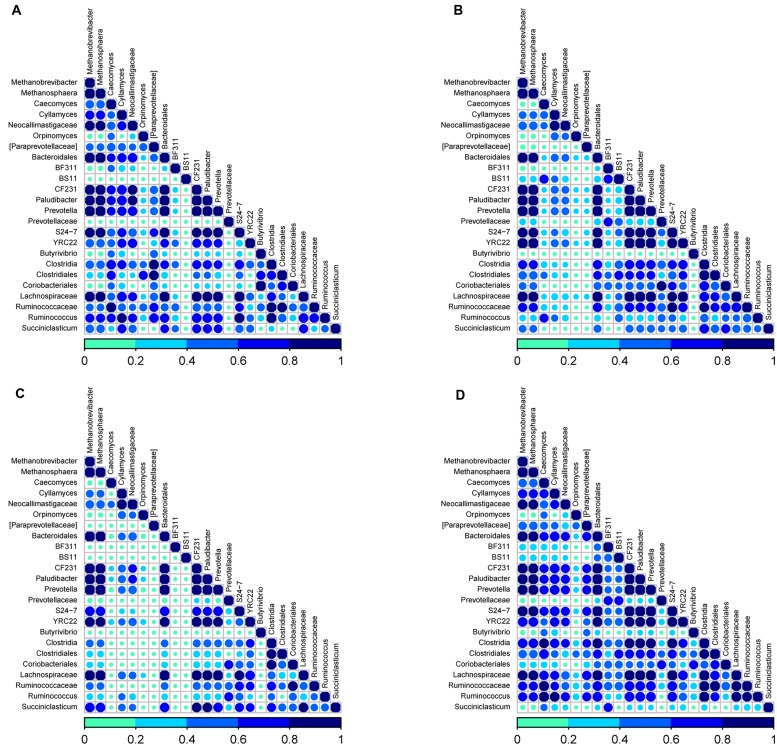
FIGURE 4.
Analysis of co-occurrence among microbial lineages scored using the Dice index (A) diet D1, (B) diet D2, (C) primiparous cows, and (D) multiparous cows. Dice indexes across all genera for bacteria and archaea pairs present at a proportion = 0.01 and for fungi at a proportion = 0.001 are shown as a heatmap. Co-occurrence is shown by the color code (navy blue: high co-occurrence, sky blue: moderate co-occurrence; green: low co-occurrence) at the bottom. Sample identifiers are same as used in Figure 1.

