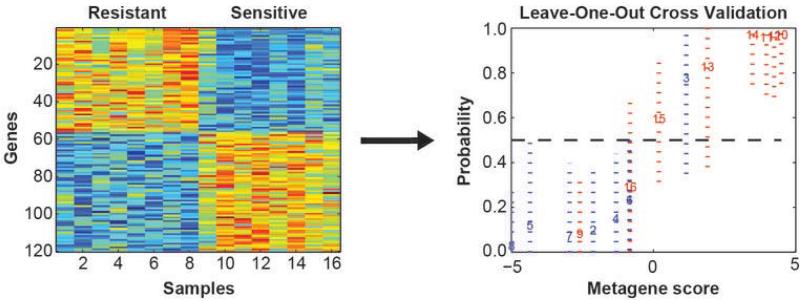
Figure 1. NCI-60 Oxaliplatin Signature Bayesian Regression Heatmap and Leave-One-Out Performance.
A subset of cell lines that represent the extremes of sensitivity to oxaliplatin were identified from the NCI-60 panel. The left panel is the expression plot for genes selected for discriminating the oxaliplatin sensitive and resistant cell lines from the NCI-60 set based on the expression levels of the 120 genes selected during the Bayesian binary regression analysis. Blue represents lowest expression and red highest. Each column represents an individual cell line and each row one of the discriminating genes in the oxaliplatin predictor. From these 120 genes, phenotype discriminatory power from sample misclassification was optimized using leave-one-out performance (right panel). The acuracy of the predictor on each samples in the leave-one-out performance are displayed with 95% CI.

