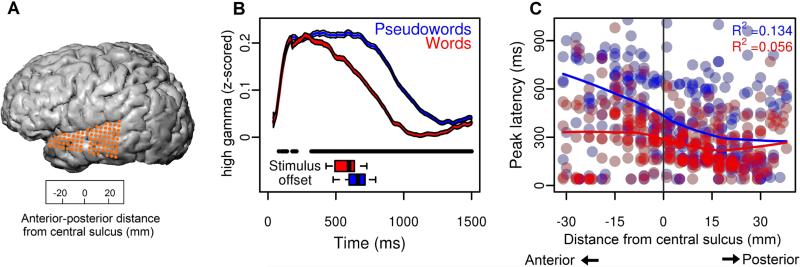
Figure 2. Spatiotemporal patterns of neural activity across electrodes.
(a) Electrode coverage for subject 1. The spatial scale of the grid is indicated in the lower box. Distance is measured along an anterior-posterior line, along the Sylvian fissure, with anatomical reference point of the ventral-most aspect of the central sulcus (position=0). (b) Average high-gamma analytic amplitude (AA) response to words and pseudowords across all electrodes (combined across all subjects). Neural responses to words (red) and pseudowords (blue; shading indicates 95% confidence intervals around the mean at each time point) show prolonged differences, with generally greater responses to pseudowords (black bar; bootstrap p < 0.05). Lower box plots show stimulus length for words and pseudowords, which are not significantly different (p = 0.148). (c) Timing of the peak of neural responses to words and pseudowords in all electrodes, in all subjects, across the anterior-posterior span of the temporal lobe.

