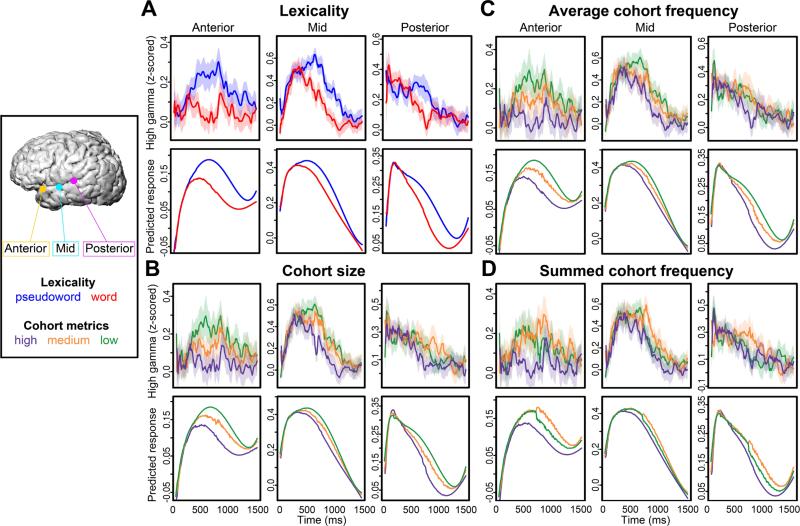
Figure 4. Linguistic variables show different effects on neural activity across time.
(a) Actual neural responses (upper plot) to words (red) and pseudowords (blue) and GCA predicted responses (lower plot) for three single electrodes show that the GCA model captures the temporal dynamics of neural activity. These responses to words and pseudowords (with 95% confidence intervals) over time from anterior, middle, and posterior temporal lobe electrodes illustrate different lexicality differences across the anterior-posterior axis of the temporal lobe. Critically, the difference between words and pseudowords varies as a function of both time and location. GCA model predicted responses for the same electrodes show similar effects, demonstrating the efficacy of this statistical technique for ECoG data. (b) Actual (upper) and predicted (lower) responses to cohort size in the same three electrodes. Cohort size is binned into high, mid, and low within each time point to show the predictor's effect on the shape of the response. The smallest cohorts had the biggest responses, particularly at anterior sites. (c) Responses and predictions for three levels of average cohort frequency in the same electrodes. Responses to cohorts with low average frequency had the strongest responses. (d) Responses and predictions for summed cohort frequency; in contrast to average cohort frequency, cohorts with mid-range summed frequency had the highest responses.

