
Figure 6a:
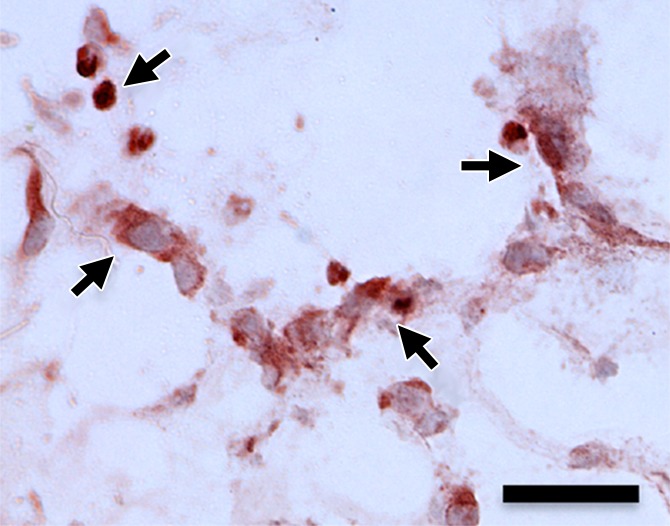
(a–d) Representative bright-field histologic sections (original magnification, ×40) after anti-GFP immunohistochemical staining from plugs exposed to 2 W/cm2 ultrasound (a) and 1 W/cm2 ultrasound (b), exposed to no ultrasound as a negative control (c), and pretransfected by using lipofectamine (d) as shown. GFP expression (reddish-brown product, arrows) is most abundant in the positive control (d) and after 2-W/cm2 ultrasound exposure. Scattered and scant GFP expression is seen after 1-W/cm2 ultrasound application and less if no ultrasound was applied. Scale bar = 10 μm.