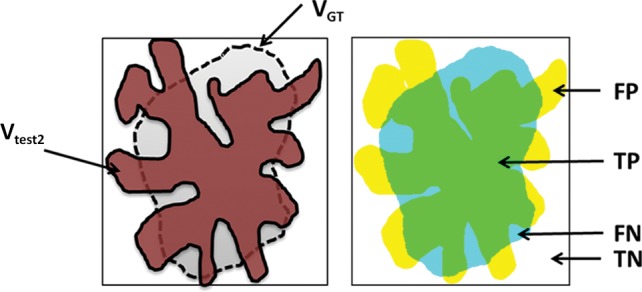
Figure 20b.

Schematic diagrams of sensitivity and specificity metrics with color-coded condition–test outcome pairs: true positive (TP) (green area), true negative (TN) (white area), false positive (FP) (yellow area), and false negative (FN) (blue area). (a) Sensitivity = 94.69%; specificity = 94.19%. (b) Sensitivity = 72.99%; specificity = 78.16%. VGT = reference standard segmentation (ground truth), Vtest = lung segmentation (brown area) obtained by using any of the segmentation methods.
