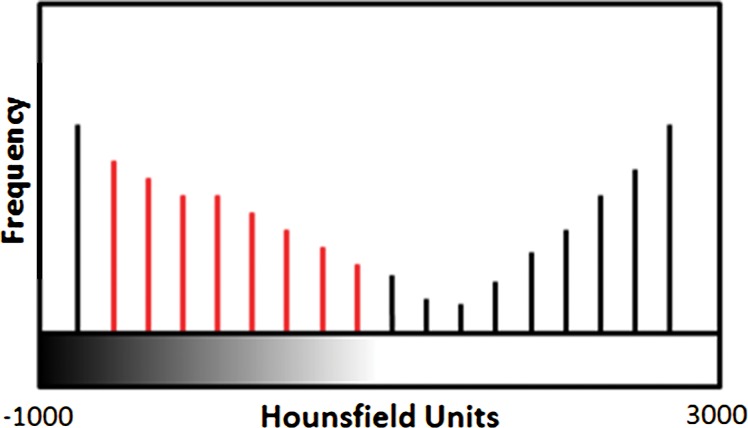
Figure 5b.
Schematic diagram providing an overview of the thresholding-based approach to lung segmentation. Graphs (a, b) show how the upper and lower threshold values (shown with red vertical lines in a, b) in Hounsfield units are adjusted to annotate the lungs on CT images (c, d). The suboptimal interval of attenuation in a results in excluded lung parenchyma (black regions in c) from the segmented lung regions (red), in comparison with the better attenuation interval in b, which results in better lung segmentation in d.

