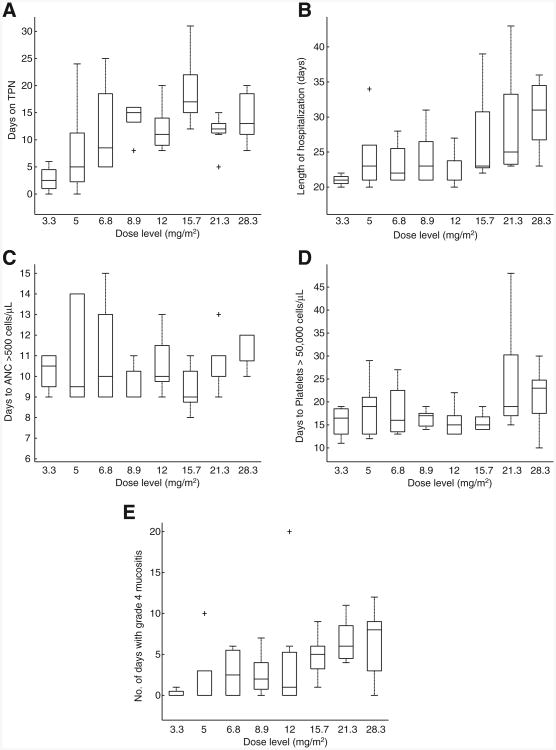
Figure 1.
Relationship between topotecan dose level and toxicity outcomes and engraftment for patients in the phase I trial. A, dose level versus days on TPN. B, dose level versus length of hospitalization. C, dose level versus days to ANC more than 500 cells/μL. D, dose level versus days to platelets more than 50,000 cells/μL. E, dose level versus number of days with grade 4 mucositis. The horizontal line in the middle of each box indicates the median, whereas the top and bottom of each box represent the 75th and 25th percentiles, respectively. The whiskers above and below the box represent the 90th and 10th percentile, respectively.

