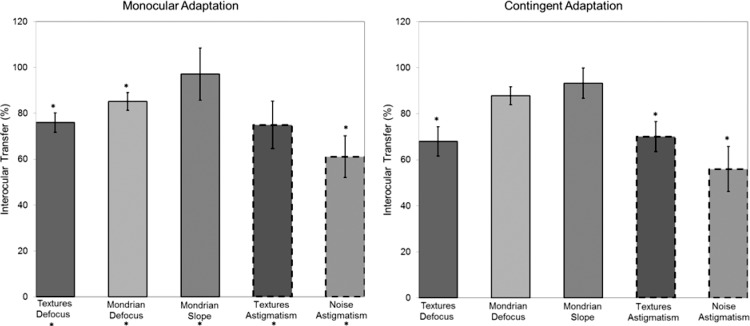
Figure 4.
Left panel: degree of interocular transfer of the aftereffects estimated from the monocular same versus different eye adaptation. Each bar represents the mean value (averaged across observers) of the index of transfer ±1 SEM for a given image set or blur condition. Asterisks above the bars indicate aftereffects that showed at least some selectivity for the stimulated eye (i.e., significantly smaller aftereffects when the adapt and test eye were different). Asterisks below the bars instead correspond to aftereffects that showed significant interocular transfer (i.e., significant aftereffects in the nonadapted eye). Right panel: degree of transfer estimated from the contingent blur adaptation. Each bar again represents the average value of the index ±1 SEM for a given image set or blur condition. Asterisks above the bars indicate aftereffects that were at least partly selective for the stimulated eye (i.e., significant differences between the aftereffects under contingent versus monocular same-eye adaptation).

