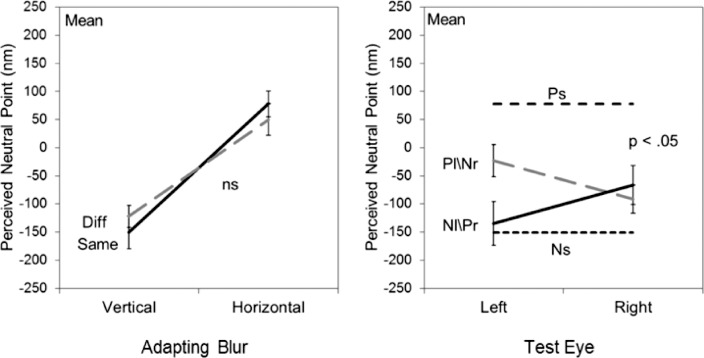
Figure 8.
Average aftereffects for three observers following adaptation to simulated astigmatism in the natural textures. Left panel: monocular adaptation; right panel: contingent adaptation. Symbols as in Figure 3. P values indicate whether aftereffects were selective for the adapting eye.

