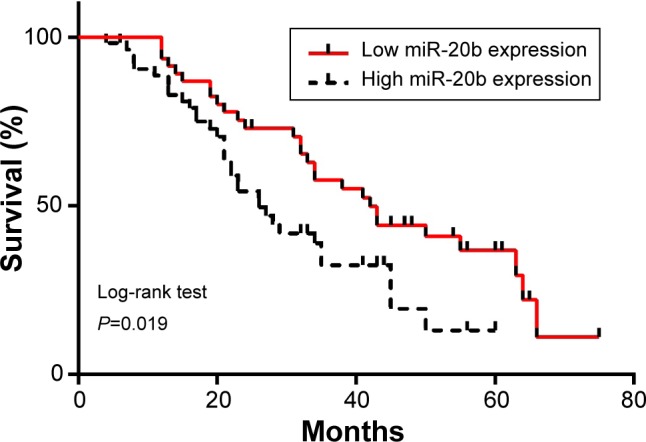
Figure 4.

Kaplan–Meier survival curve of patients with GC.
Notes: Patients in the high expression group had a significantly poorer prognosis than those in the low expression group, as analyzed by log-rank tests as indicated (P=0.019).
Abbreviation: GC, gastric cancer.
