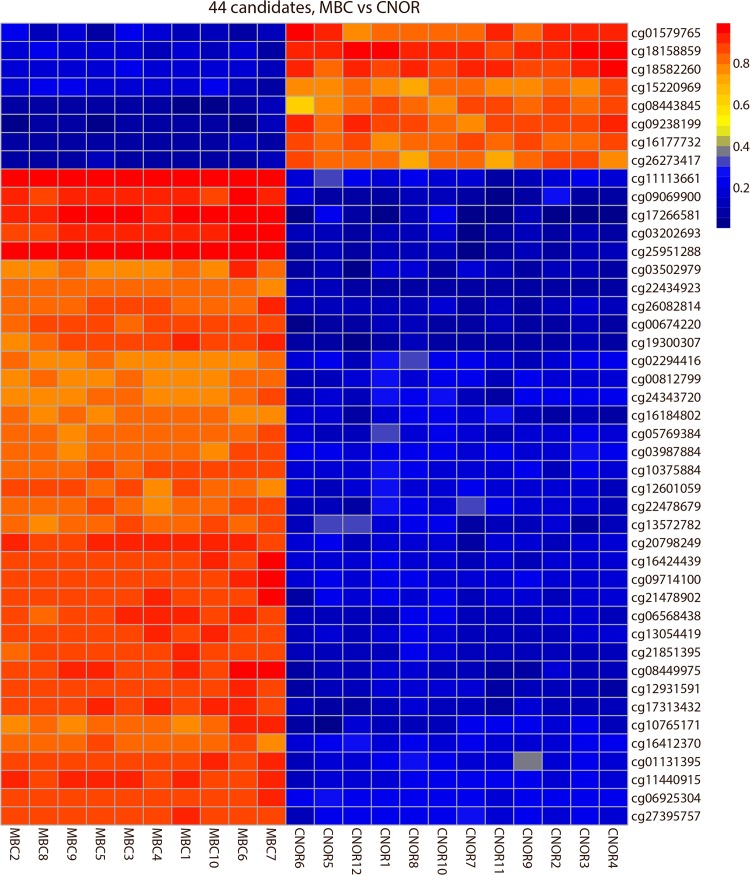
Fig 3. Heatmap visualization of the DNA methylation of 44 differentially methylated CpGs (DMCs) on Chromosome 13, 18 and 21.
Rows represent CpG targets, columns represent samples. Each cell is colored according to the level of methylation (β-value).Blue; low β-values, yellow; intermediate β-values, red; high β-values.

