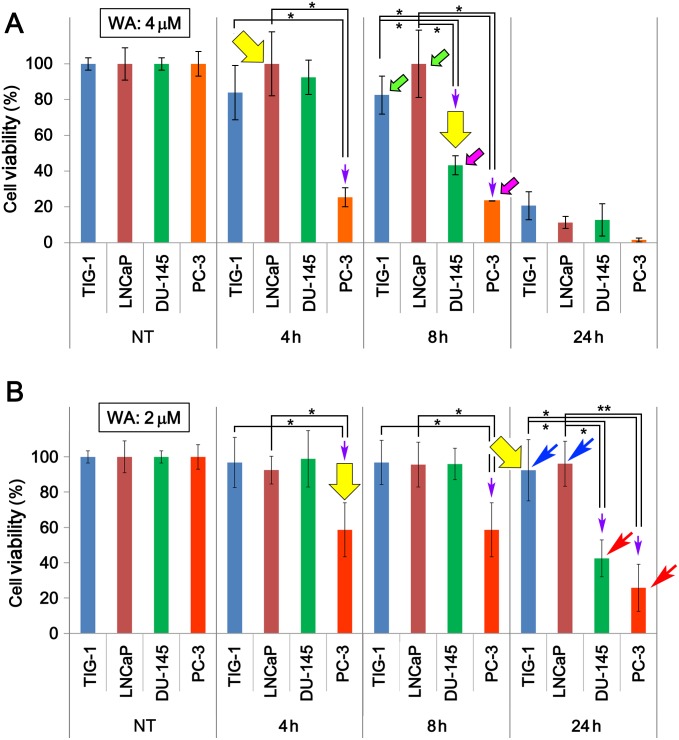
Fig 1. Cell viability of TIG-1, LNCaP, DU-145, and PC-3 cells after WA treatment.
(A, B) Cell viability was measured at 4, 8, and 24 h after 2 μM (A) or 4 μM (B) WA treatment. NT, non-treated. Green and blue arrows indicate bars for surviving cells, whereas pink and red arrows indicate bars for cells that died under the same conditions. Yellow arrows indicate the samples used for DNA microarray analysis. Bars represent means ± SEM for three independent experiments. Purple arrows indicate significant reductions in cell viabilities (*, P < 0.05; **, P < 0.01).

