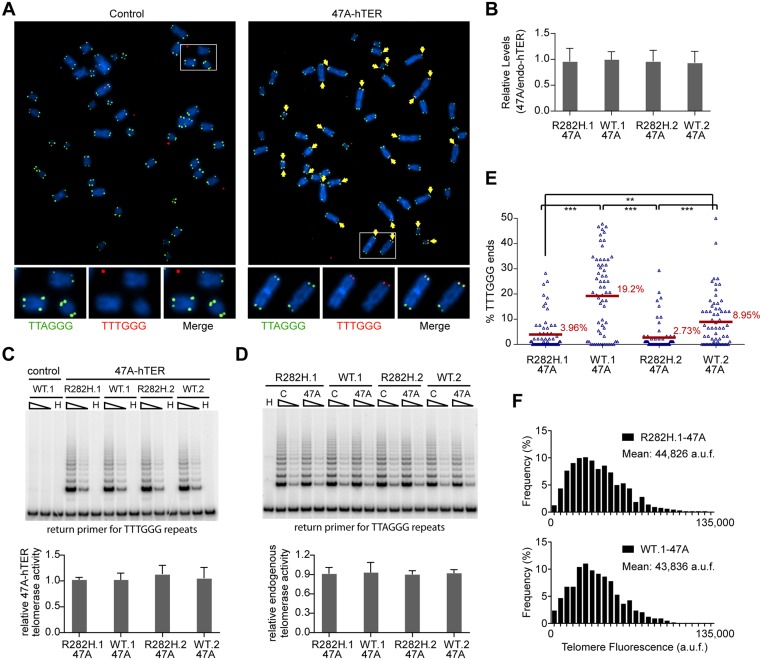
Fig 3. Heterozygous TIN2-R282H mutation decreases the frequency of telomere extension by telomerase.
HCT116 knock-in clones were infected with lentivirus expressing 47A-hTER to achieve a 1:1 steady state expression level of 47A-hTER: endogenous-hTER in each clone. 8 days after infection, parallel cultures of cells were collected for metaphase spreads followed by telomeric FISH, for quantitative PCR, for TRAP assay, and for counting of cell numbers. (A) Representative telomeric FISH images showing 47A-hTER-directed incorporation of TTTGGG variant repeats at telomeres in WT.1 cells. Cells were infected with an empty lentiviral vector control or lentivirus expressing 47A-hTER. Telomeric FISH was carried out using PNA probes for the canonical TTAGGG repeats (green) and the variant TTTGGG repeats (red). Telomeres incorporating TTTGGG repeats were marked with yellow arrows. Regions encircled in white boxes are enlarged at the bottom of the corresponding image for better visualization. (B) Relative steady state expression levels of 47A-hTER determined using QPCR. Expression levels were normalized to GAPDH and relative to respective endogenous telomerase RNA levels in each clone. Bars represent mean values of three experiments and SDs. (C) 47A-hTER assembles into equivalent levels of active telomerase in all knock-in clones. Top panel: whole cell extracts were examined for 47A-hTER-containing telomerase activity by 47A-hTER-specific TRAP assay using return primer 5’-GCGCGGTACCCATACCCATACCCAAACCCA-3’. Extracts from 400 and 100 cells were analyzed for each sample. WT.1 cells infected with the empty lentiviral vector was used as control to show the specificity of the TRAP assay conditions. Bottom panel: Quantification of relative TRAP activity of 47A-hTER-containing telomerase in each indicated clone, relative to that in R282H.1–47A cells. Bars represent mean values of three experiments and SDs. (D) Endogenous wild-type telomerase activity in knock-in clones infected with an empty lentiviral vector or lentivirus expressing 47A-hTER. Top panel: the same whole cell extracts as described in (C) were examined for endogenous wild-type telomerase activity using return primer 5’- GCGCGGTACCCTTACCCTTACCCTAACCCT-3’. Extracts from 100 and 25 cells were analyzed for each sample. Bottom panel: Quantification of relative endogenous wild-type telomerase activity in each indicated clone, relative to respective clones infected with a lentiviral vector control. Bars represent mean values of three experiments and SDs. (E) Quantification of fraction of telomeres incorporating TTTGGG repeats in knock-in clones expressing 47A-hTER. Data were obtained analyzing > 2500 chromosomes in ~60 metaphase spreads from each clone. All quantifications were carried out blindly. Each point on the graph represents a single metaphase spread. Mean values are indicated in red. *** (p≤0.001) ** (p≤0.01) calculated by two-tailed Student’s t-tests. (F) Quantification of telomeric TTTGGG fluorescence intensity. The distributions of fluorescence intensities, in arbitrary fluorescence unit, of more than 600 telomeric TTTGGG spots from metaphase spreads of each indicated clone are displayed. All quantifications were carried out blindly.

