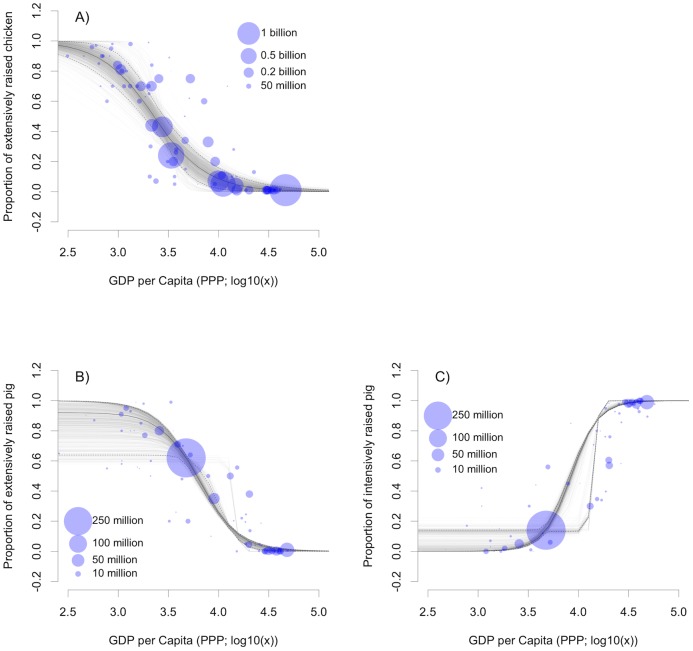
Fig 2. Models of the proportions of extensively raised chickens (a) and pigs (b) and of intensively-raised pigs (c) as a function of GDP per capita (USD, Purchasing Power Parity for 2010).
Each dot represents a country for which P ext and P int was established through data-mining (n = 86 for chicken, n = 97 for pig), with the size indicative of the stock according to FAOSTAT [5].

