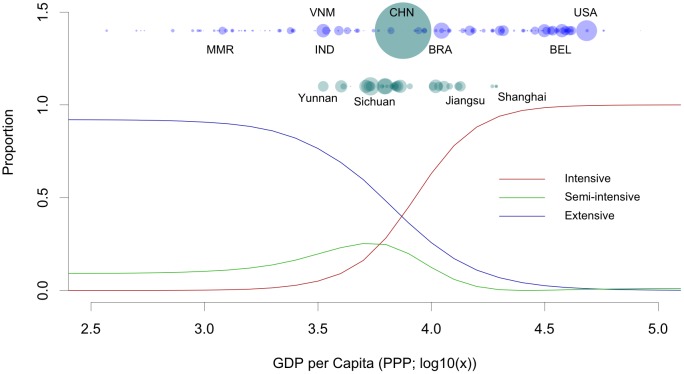
Fig 3. Predicted proportions of pigs raised under extensive, semi-intensive and intensive production systems as a function of GDP per capita (USD, Purchasing Power Parity).
The top row of points indicates the position of different countries along the gradient of GDP per capita, with the size of the points indicative of the national stock according to FAOSTAT [5]. A selection of countries is indicated by their ISO-3 codes.

