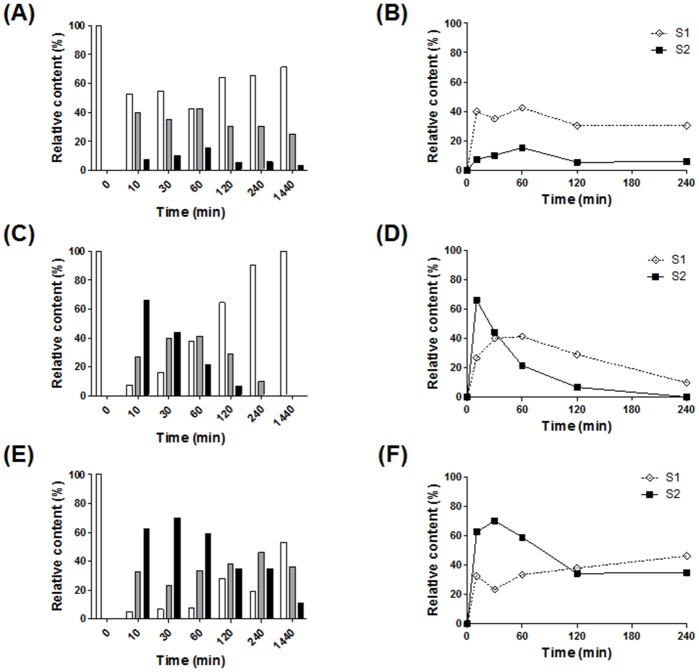
Fig 3. Prolonged incubation of bacterial α(2,6)-ST reaction decreased sialylated glycans.
The time-courses of the enzyme reactions were performed at 30°C using Pd- (A and B), P224- (C and D), and P145-STs (E and F). In the bar graphs (A, C, and E), relative contents (%) of G2 (white bar), S1 (gray bar), and S2 (black bar) glycans are represented from 0–1,440 min, which were obtained by the calculation of integrated peak areas (100 × [The areas of corresponding glycan peaks]/[Total areas of all identified peaks]). In line graphs (B, D, and F), relative contents (%) of S1 (open diamond) and S2 (filled square) glycans are represented from 0–240 min.

