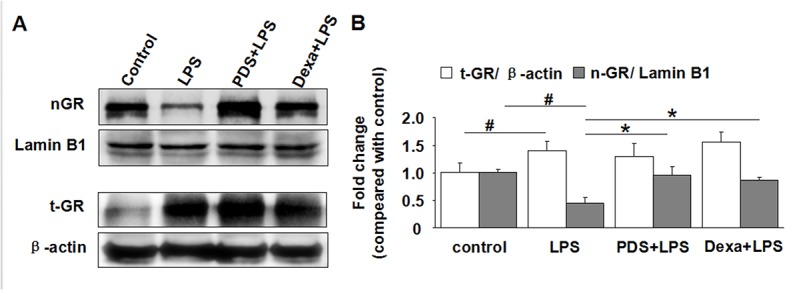
Fig 6. Western blot analysis of expression and nuclear translocation of GR in kidney.

A: Expression of nuclear (nGR) and total GR (tGR) in kidney tissues detected by western blotting. B: Density ratio of nGR with β-actin and tGR with Lamin B1. GR: glucocorticoid receptor; LPS: lipopolysaccharide; PDS: Panaxadiol saponins; Dexa: dexamethasone. Data represent mean ± SEM. #P<0.05 vs. control group; *P<0.05 vs. LPS group (n = 3 per group).
