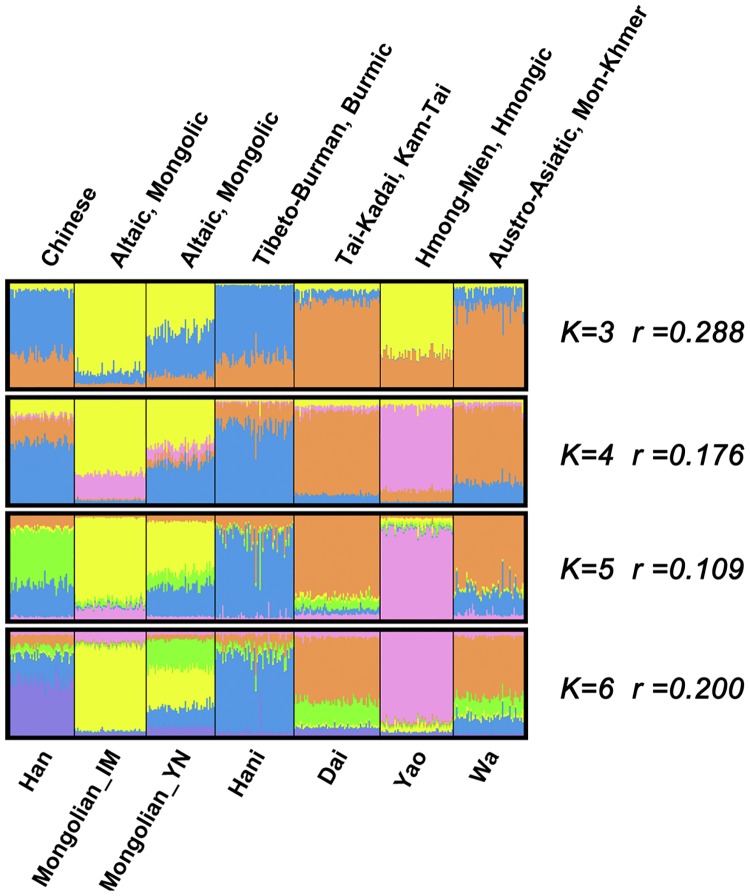
Fig 2. Clustering analysis from STRUCTURE.
Population structure was investigated using STRUCTURE software, assuming K = 3, 4, 5, and 6. Populations were ordered according to their linguistic affiliations. Linguistic affiliations and population names are labeled above and beneath the plot. According to the guidelines in the STRUCTURE manual and ΔK values at different Ks, K = 5 is the most appropriate value. The r values indicate that more information is given with the LOCPRIOR model than without it.

