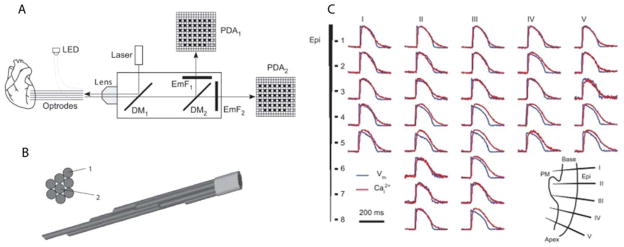
Figure 7.

A: schematic diagram of the optical system. LED, light-emitting diode; DM1 and DM2, first and second dichroic mirrors, respectively; EmF1, emission filter; PDA1 and PDA2, first and second photodiode arrays, respectively. B: cross-sectional and side views of the of the optrode tissue end. C: Intramural membrane voltage (Vm) and intracellular Ca2+ (Cai2+) measured during regular rhythm. A: raw traces of Vm (blue) and Cai2+ (red) from five optrodes. The inset in the bottom right corner schematically shows the optrode insertion sites. PM, papillary muscle; Epi, epicardium. Modified with permission from Kong et al. [121].
