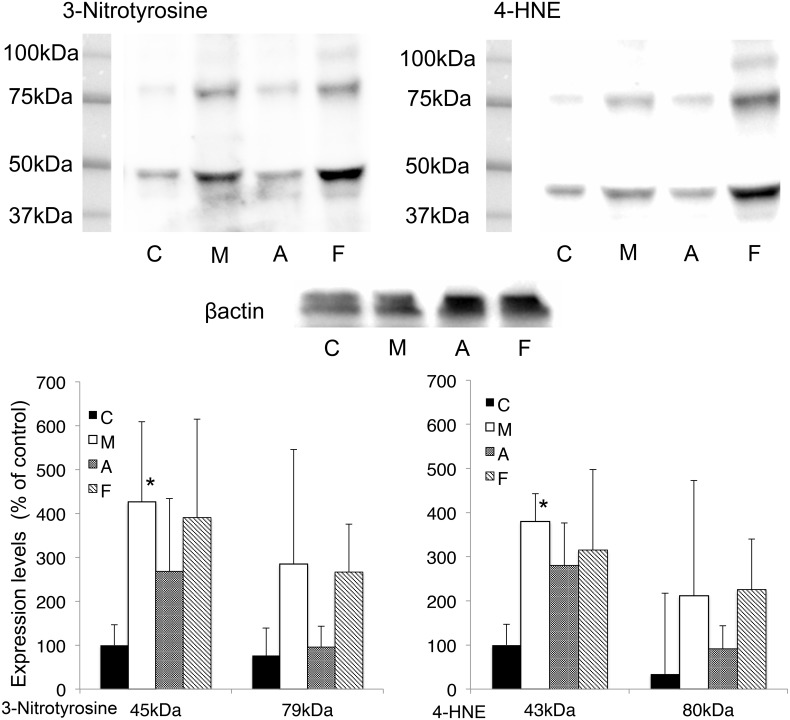
Fig 3. Effects of XOR inhibitors, showing changes in protein nitration and lipid peroxidation.
Solid bars represent control groups (C). Open bars represent methylcellulose groups (M). Dotted bars represent allopurinol groups. Diagonal bars represent febuxostat groups (F). The intensity levels are given as the mean ± SD normalized to β-actin level for each sample. (n = 6) *P<0.05 vs. control. C; Control, M; Methylcellulose, A; Allopurinol, F; Febuxostat. The entire images are shown in S4–S6 Figs.

