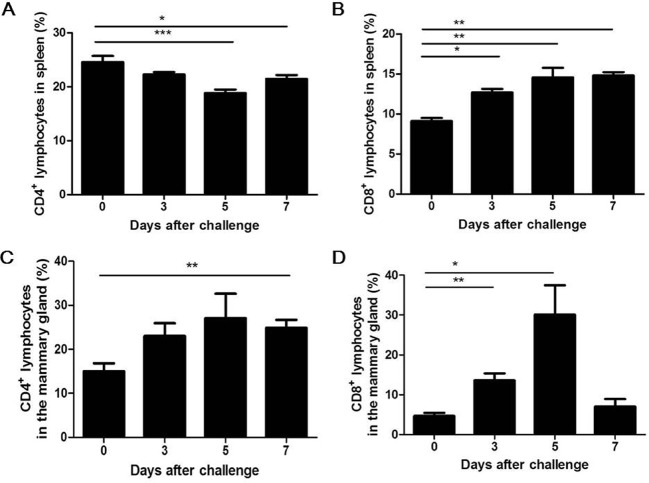
Fig 2. Both T helper and T killer cells are induced in response to S. aureus intramammary infection.
Lactating mice were challenged with 4 × 10⁶ CFUs of S. aureus in the mammary gland. At the indicated times, PBMCs were prepared, and cell surface markers were stained for flow cytometry analysis. The percentages of CD4+ lymphocytes in the spleen (A) and mammary gland (C) are indicated. The percentages of CD8+ lymphocytes in the spleen (B) and mammary gland (D) are indicated. The data shown are the mean ± SEM (n = 6) of three representative experiments with similar results. * p < 0.05, ** p < 0.01, *** p < 0.001.

