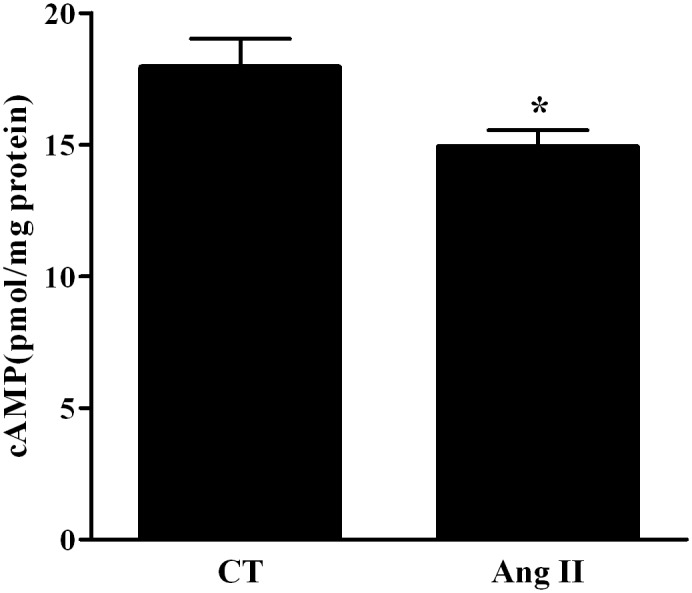
Fig 5. Levels of cAMP.

Levels of cAMP were decreased in Ang II treated AEC II cells by 0.17 folds compared to the control group. * P < 0.05 As compared to control group. CT—Control. Ang II—Angiotensin II. The bars represent mean ± SEM.

Levels of cAMP were decreased in Ang II treated AEC II cells by 0.17 folds compared to the control group. * P < 0.05 As compared to control group. CT—Control. Ang II—Angiotensin II. The bars represent mean ± SEM.