
Fig 5. Correlation between syncytin-1 expression and syncytin-1 methylation index in normal and adenocarcinoma tissues.
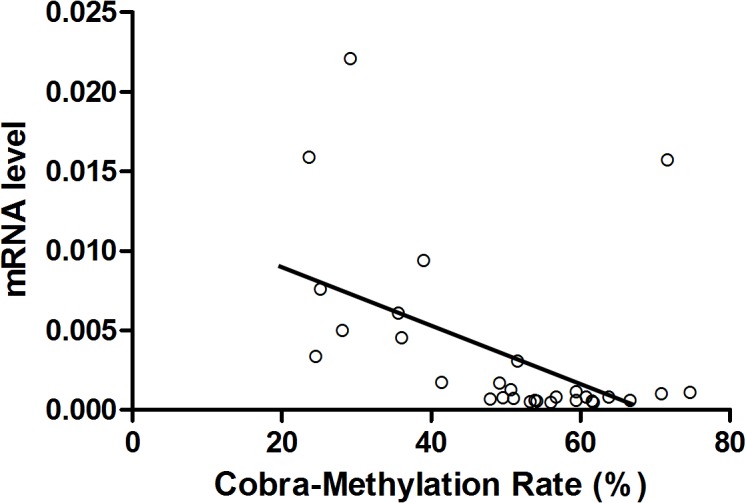
The Y-axis indicated syncytin-1 mRNA levels and the X-axis represented syncytin-1 DNA methylation index. Spearman’s correlation analysis showed a highly significant positive correlation between syncytin-1 mRNA levels and syncytin-1 promoter methylation levels among normal and adenocarcinoma tissues (r = -0.558, p = 0.001).