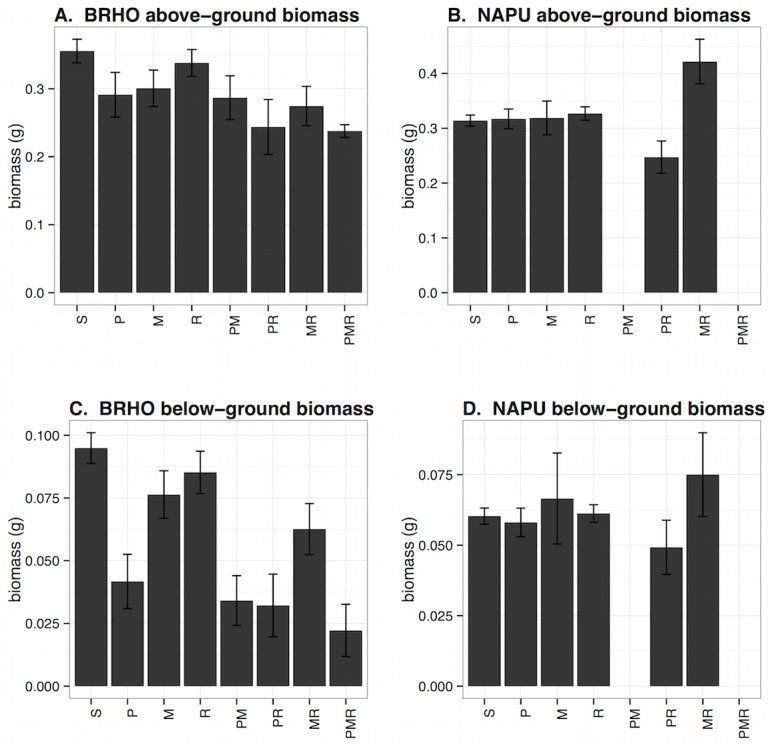
Fig 5. Biomass of plants in each infection class.

A and B, above-ground biomass and C and D, below-ground biomass, both in grams. A and C are Bromus hordeaceus and B and D are Nassella pulchra. Infection classes are: S = susceptible, P = PAV only, M = MAV only, R = RPV only, PM = PAV-MAV, PR = PAV-RPV, MR = MAV-RPV, PMR = PAV-MAV-RPV. Data are from all plants in the experiment. Error bars are +/- 1 SE.
