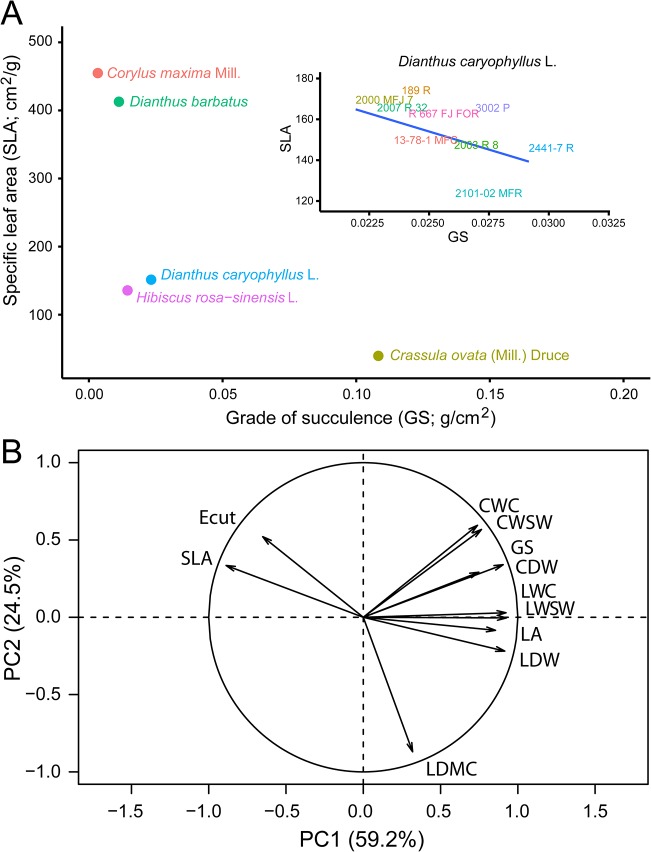
Fig 4. Stem cutting ecophysiology.
(A) Representative distribution of species according to SLA and GS average values. Insert: Distribution of the D. caryophyllus cultivars studied in this work. (B) Principal component analysis of ecophysiological parameters. Graphical representation of PC1 and PC2 are shown.

