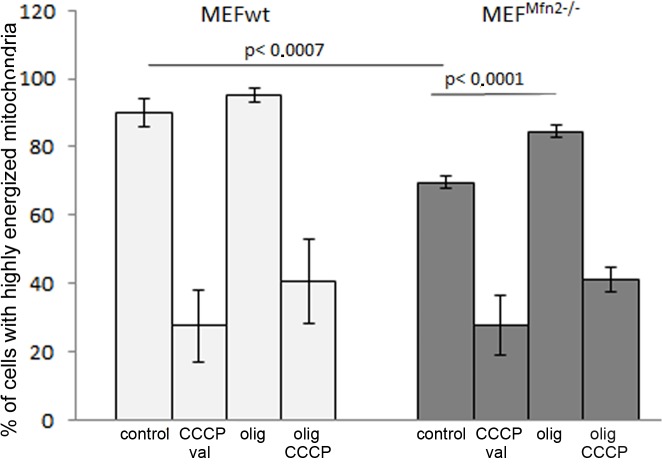
Fig 3. Mitochondrial membrane potential in MEFwt and MEFMfn2-/- cells.
The cells were grown in the medium supplemented with FBS. Mitochondrial membrane potential was determined fluorimetrically with JC-1 probe using flow cytometry. JC-1 fluorescence was measured in TO-PRO-3 negative cells (more than 95% of total population), which were assumed as 100%. Ordinate shows a proportion of cells with energized mitochondria. Data show mean values ± S.D. n = 6.

