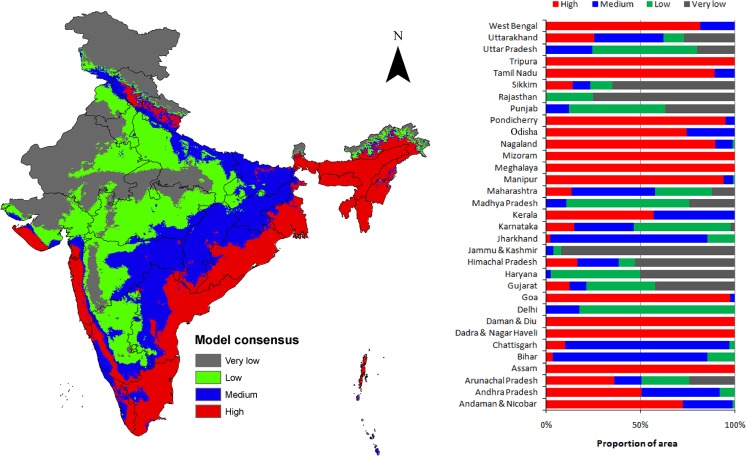
Fig 4. Model consensus classes depicting climatic suitability for diverse IAS in India.
The bar diagram depicts the percentage of total geographical area under various consensus class in different states of India. The climate suitability map was generated by combining 525 thresholded model projections from Africa, Australia, Europe, North America and South America. The legend show the model agreements, wherein 'high' represents the areas with highest range of model agreements, and 'very low' having the lowest range of model agreements. 'High' agreement represent high species richness, while 'low' agreement represent low species richness.

