
Fig 6. Matrix depicting the 3 components viz. climatic suitability, ecoregions and anthropogenic biomes, used for delineation of invasion hotspots in India.
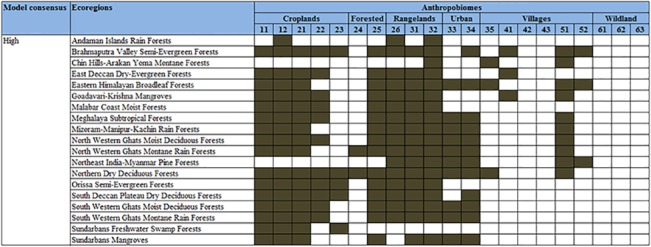
The identified ecoregions have > 50 percent of its area under the high climatic suitability. The numbers on top of the matrix indicate the major categories of anthropogenic biomes: Croplands: (11) Residential irrigated cropland, (12) Residential rainfed mosaic, (21) Populated irrigated cropland, (22) Populated rainfed cropland, (23) Remote croplands; Forested: (24) Populated forests, (25) Remote forests; Rangelands: (26) Residential rangelands, (31) Populated rangelands, (32) Remote rangelands; Urban: (33) Urban, (34) Dense settlements; Villages: (35) Rice villages, (41) Irrigated villages, (42) Cropped & pastoral villages, (43) Pastoral villages, (51) Rainfed villages, (52) Rainfed mosaic villages; Wild Land: (61) Wild forests, (62) Sparse trees, (63) Barren. Description of the anthropogenic biomes is given in Ellis and Ramankutty (2008), and details on ecoregion-wise information can be viewed at http://www.globalspecies.org/ecoregions. The filled boxes signify representation of the particular anthropobiome in each ecoregion.