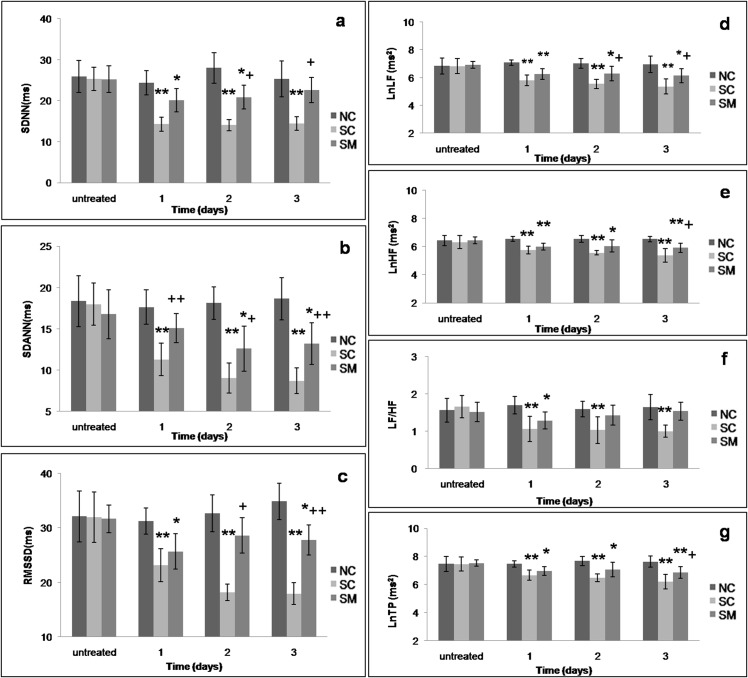
Fig 2. HRV analysis of rats.
a-c: Dynamic changes in the time-domain analysis of HRV during three days of 6-OHDA injections. d-g. Dynamic changes in the frequency-domain analysis of HRV during three days of 6-OHDA injections. The parameters of frequency-domain analysis for HRV (LF, HF, and TP) were transformed by calculating their natural logarithms.* P<0.05,** P<0.01 vs. NC group. +P<0.05, ++P<0.01 vs. SC group.

