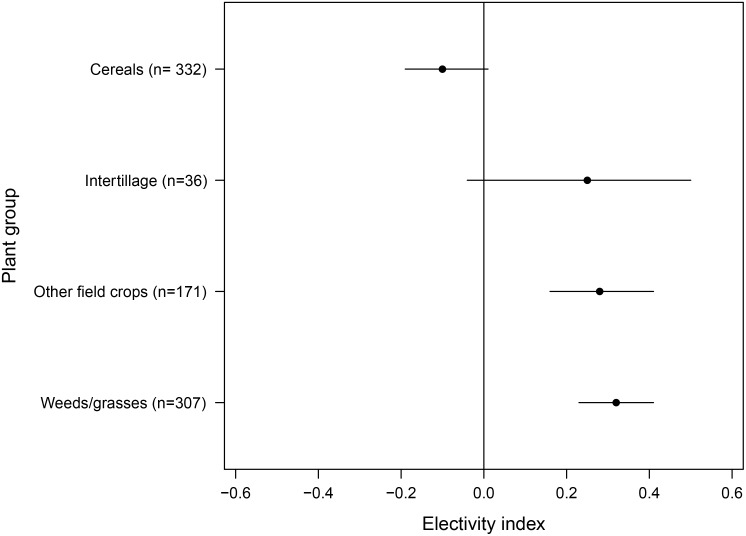
Fig 4. Chesson’s Electivity Indices for plant groups.
Chesson’s Electivity Indices in European hares (n = 399) and their distributions of 1000 bootstrap resamples (mean and 95% confidence interval) for plant groups which were selected by n≥7 hares (sample size in brackets is the number of hares selecting the respective plant groups). Non-significant results cross the vertical line at zero. See text for details of statistics.

