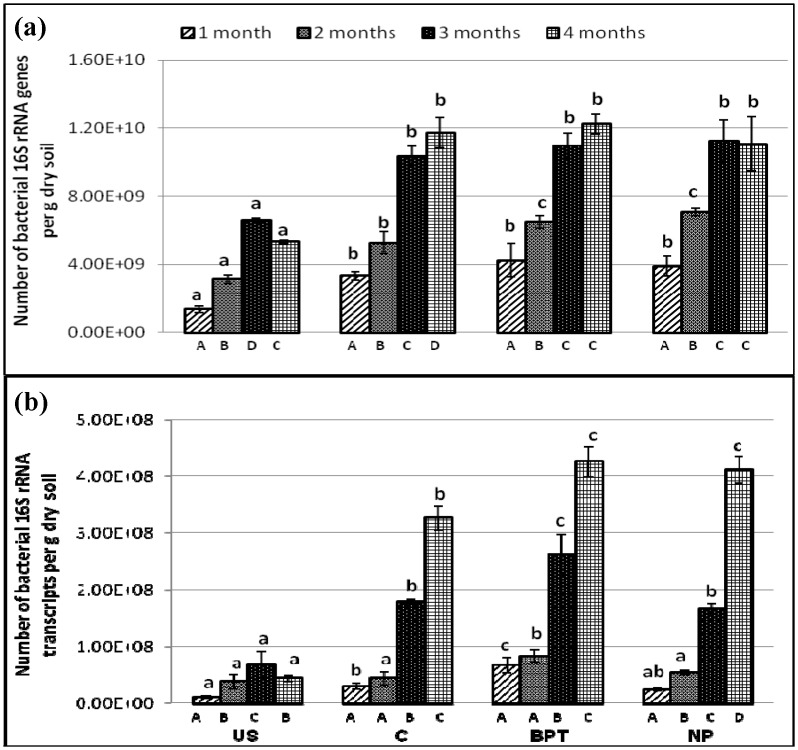
Fig 2. Abundance (copies per g dry soil) of bacterial 16S rRNA (a) genes (b) transcripts under different treatments at four time points.
Error bars represent standard deviations (n = 3). Significantly different values (p < 0.05) between different sampling time points in the same treatment are marked by capital letters (A to D) under the columns, and between different treatments for the same time point are marked by lower case letters (a to c).

