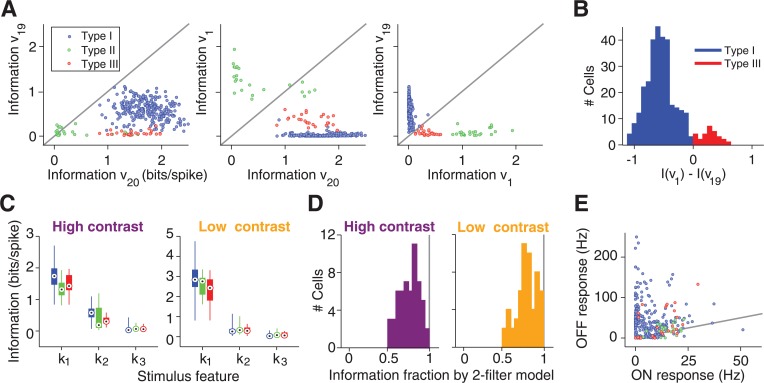
Fig 2. Information-theoretic analysis of relevant stimulus features.
(A) Scatter plots of information rates carried by the features corresponding to the most positive (v 1) and the two most negative (v 19, v 20) eigenvalues under high-contrast stimulation. (B) Histogram over all Type I and Type III cells of the difference in information rates for v 1 and v 19. (C) Distributions of information rates for the three most informative stimulus features, k 1, k 2, and k 3, respectively, extracted from the STC analyses. The bar graphs denote the median by a circled black dot, the range between first and third quartile by a thick bar, and the entire range of information values by a thin line. (D) Histograms of the fraction of information captured jointly by k 1 and k 2, relative to the total information per spike. This analysis was performed only for a subset of cells where recordings with repeated white-noise sequences were available for measuring the total information. (E) Average firing rates for each cell to alternating bright (“ON response”) and dark (“OFF response”) illumination. The gray line depicts equality.

